What we do · 01 / 05
Infographics &ScienceIllustration
Visual translation of scientific and technical content into clear, engaging graphics.
You’ll want us if…
When words are not enough, infographics carry the message. Each one is designed from the science, for the people who will read it.
- Your report, article or funding application needs one strong figure to explain a concept, a process or a dataset.
- Leadership, practitioners or the public need your findings without reading the full report.
- You have more to say than one page allows, and less than a report.
- You are reaching youth or a community group, and a less formal format will reach them better.
- Your story unfolds across a landscape, and a map would carry it better than text.
Infographics aren’t just about pretty pictures. They are a strategic blend of art and science, designed to break the walls of the ivory tower.
Infographics have been shown to increase the impact and retention of science by keying into people’s natural desire for visual information. They are also associated with higher citation rates for scientific papers.
Five products, each for a different need
A figure, an infographic, a briefing note, a zine or a story map. Pick one to see what it is, when to choose it, and work we have done.
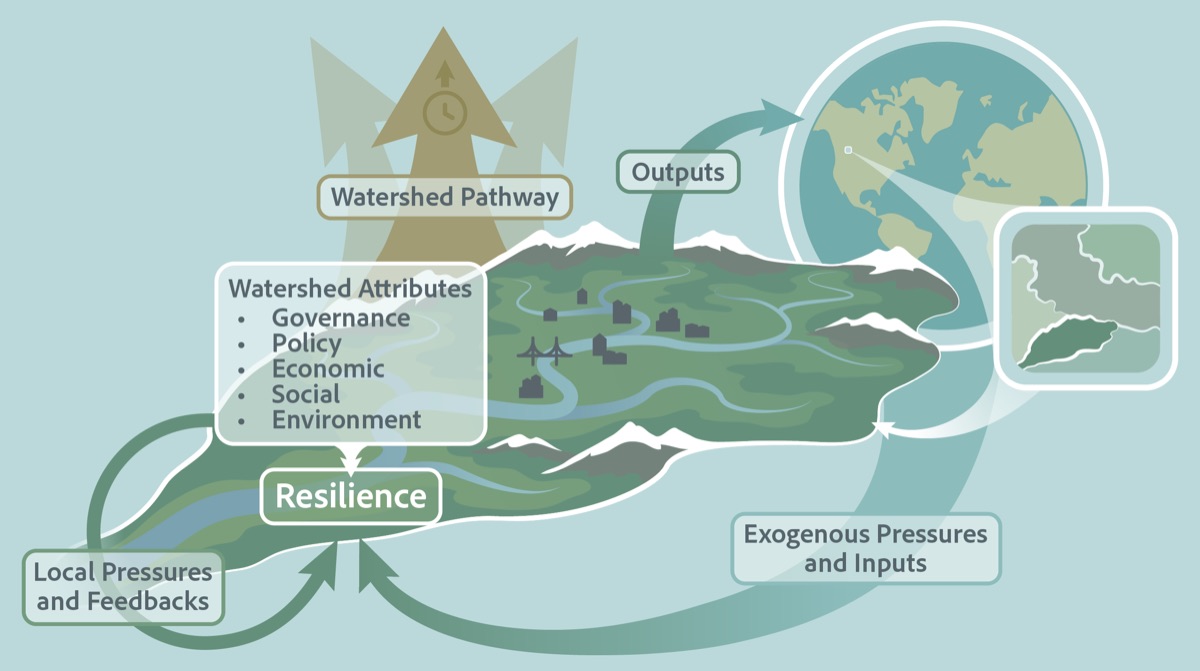
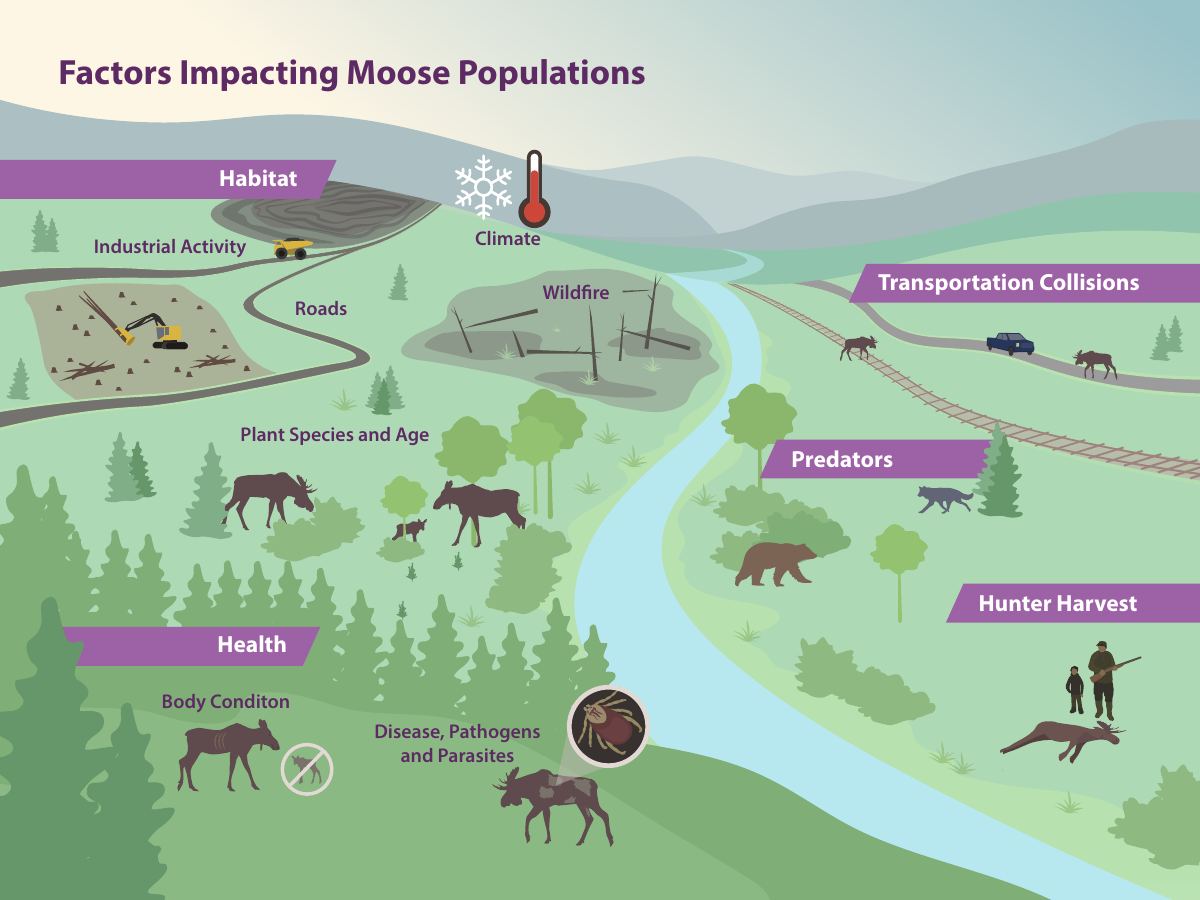
Figure
A scientific graphic — chart, diagram or illustration — designed to sit inside a larger document.
Choose it whenYour report, article, infographic or funding application needs one strong visual to explain a concept, a process or a dataset.
- Purpose
- Clarify a specific concept, process or dataset.
- Format
- A single graphic, delivered in high resolution (PNG, PDF or EPS) for your document.
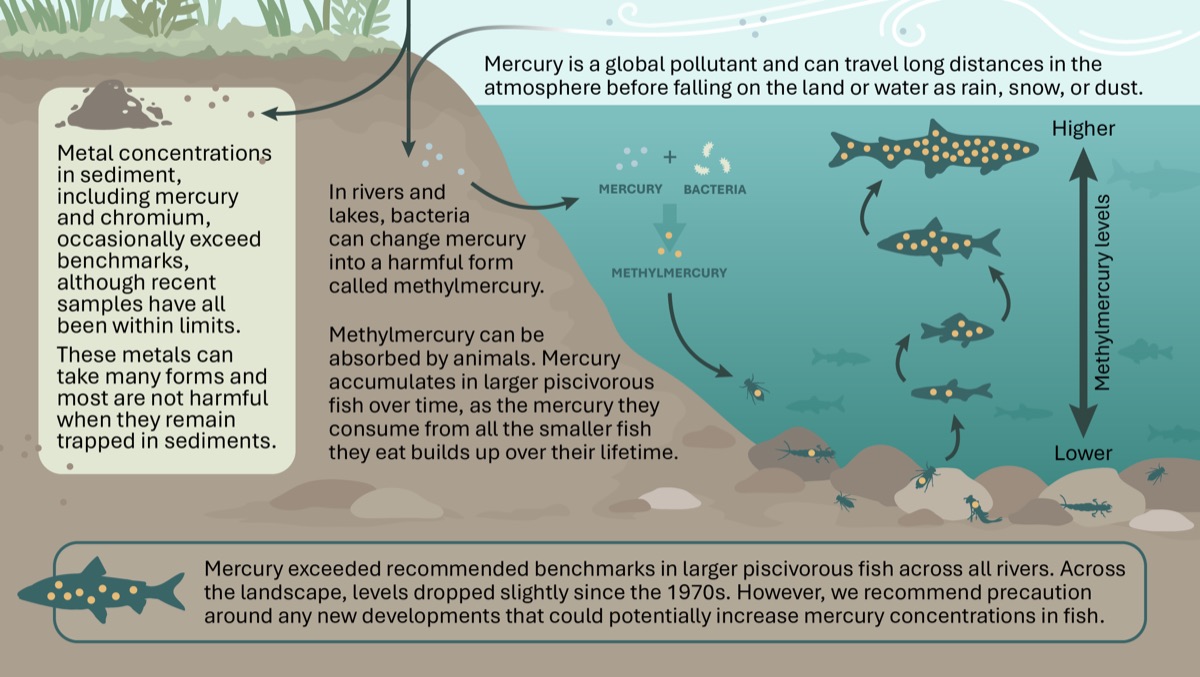
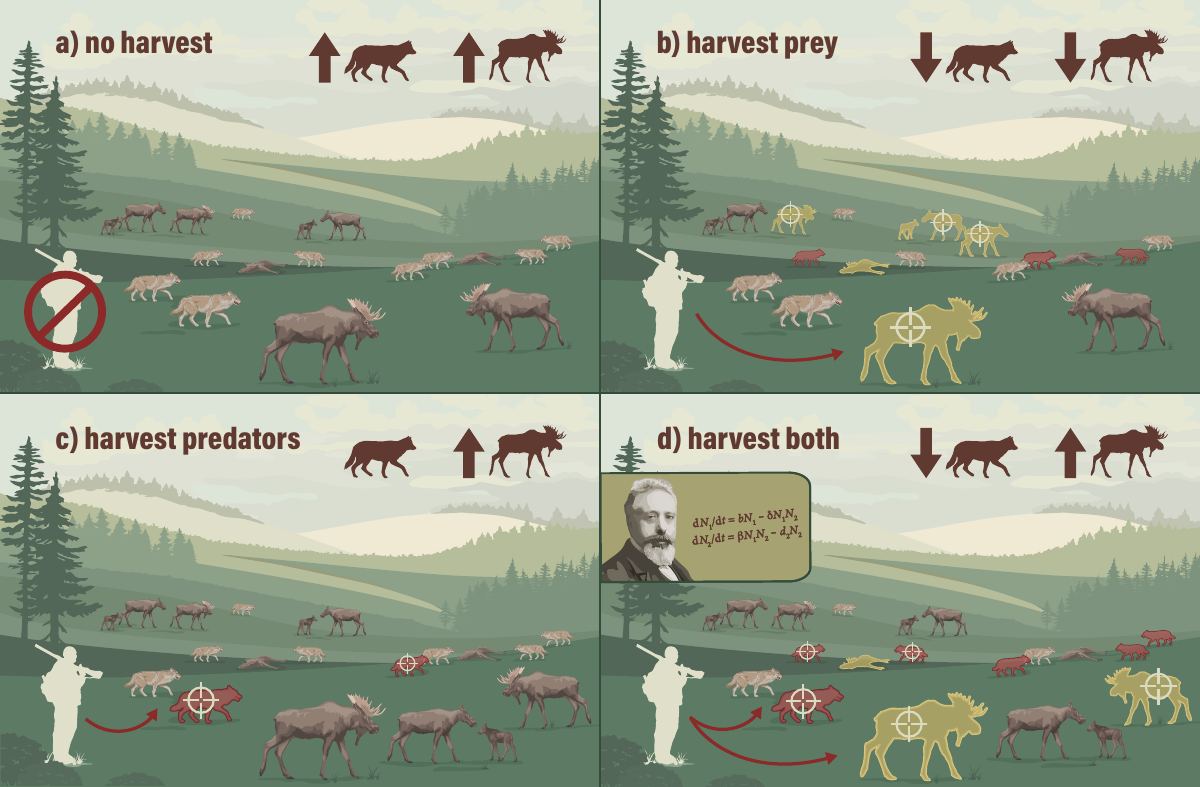
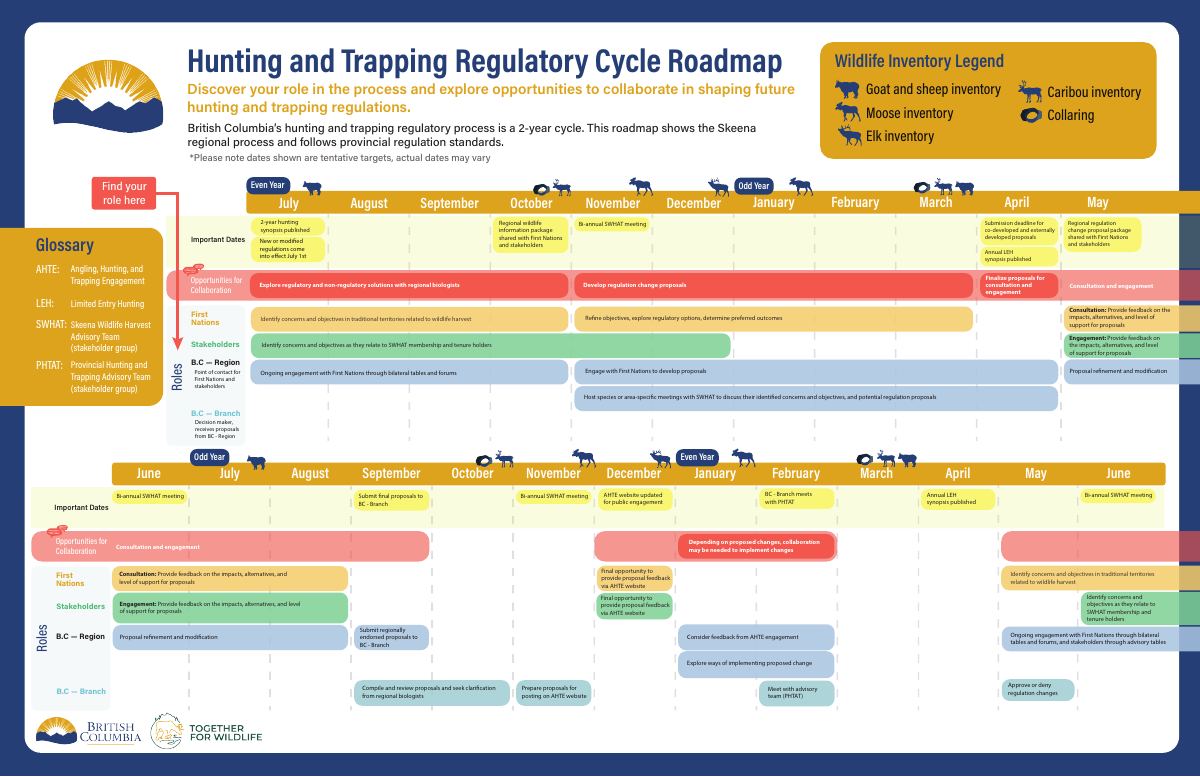
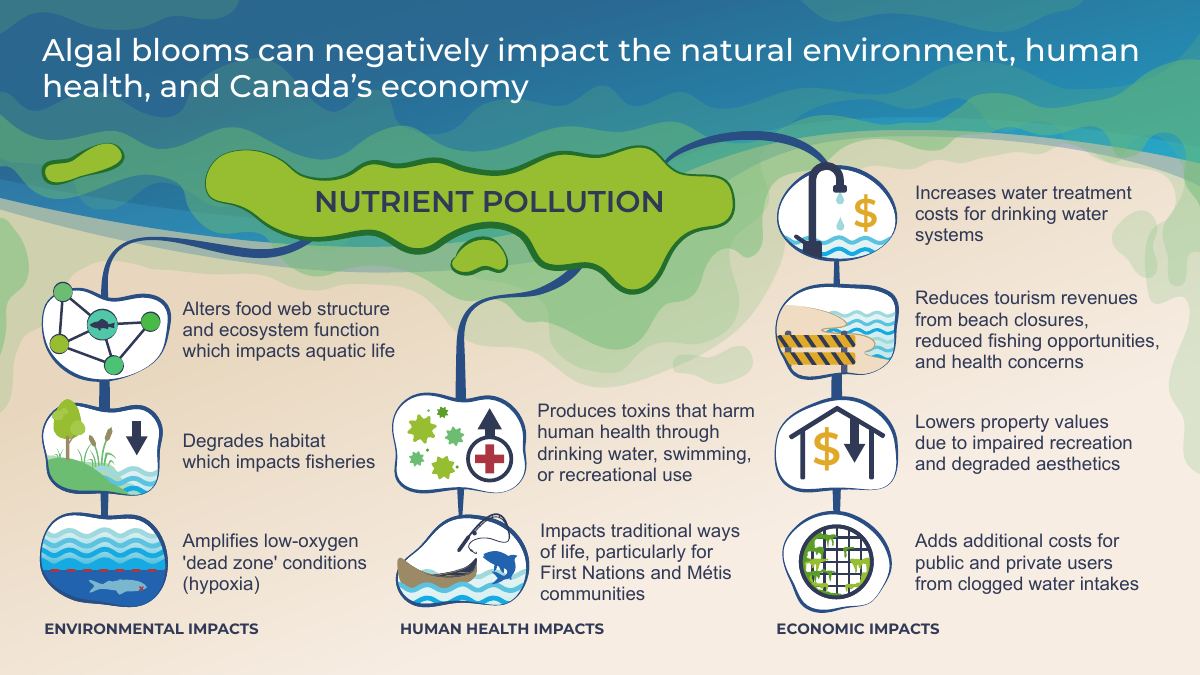
Infographic
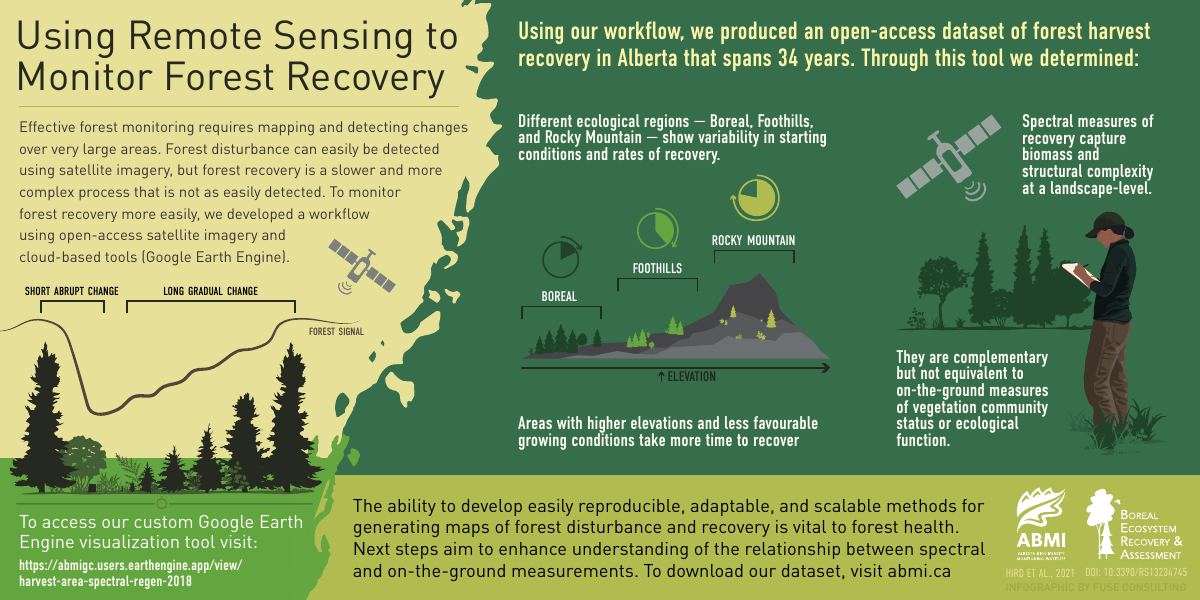
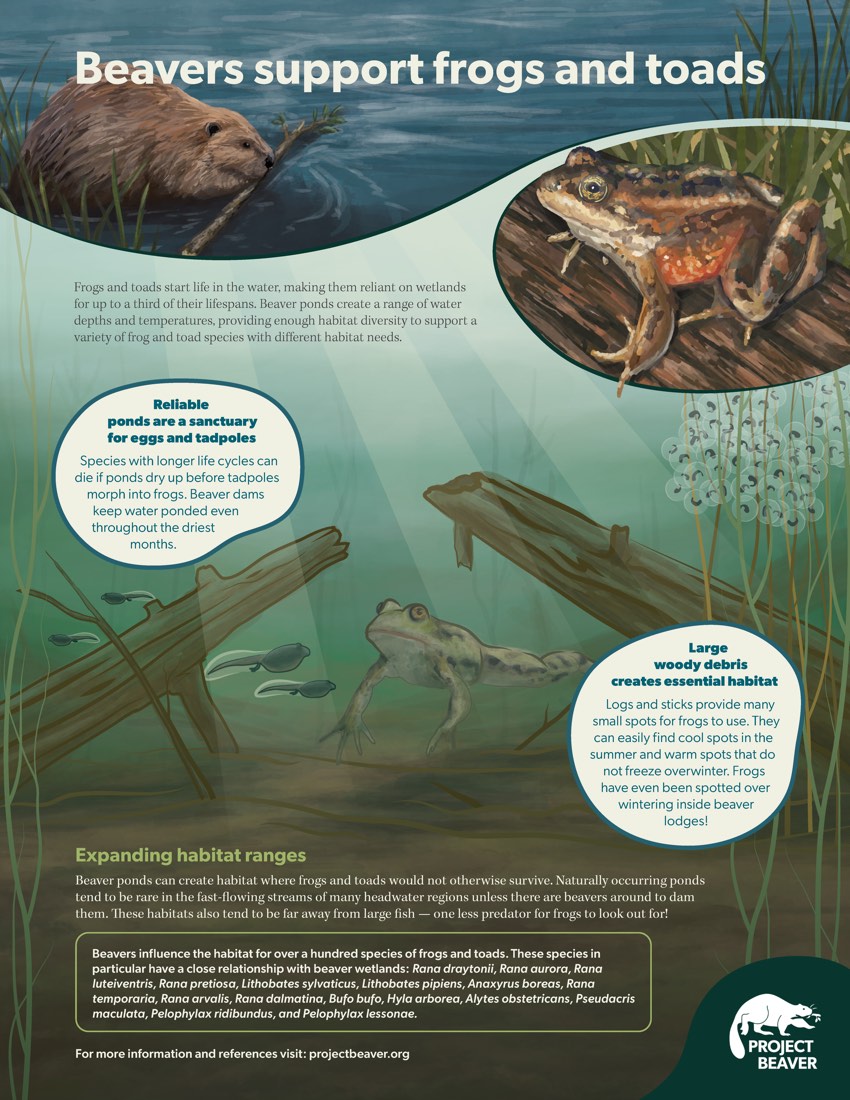
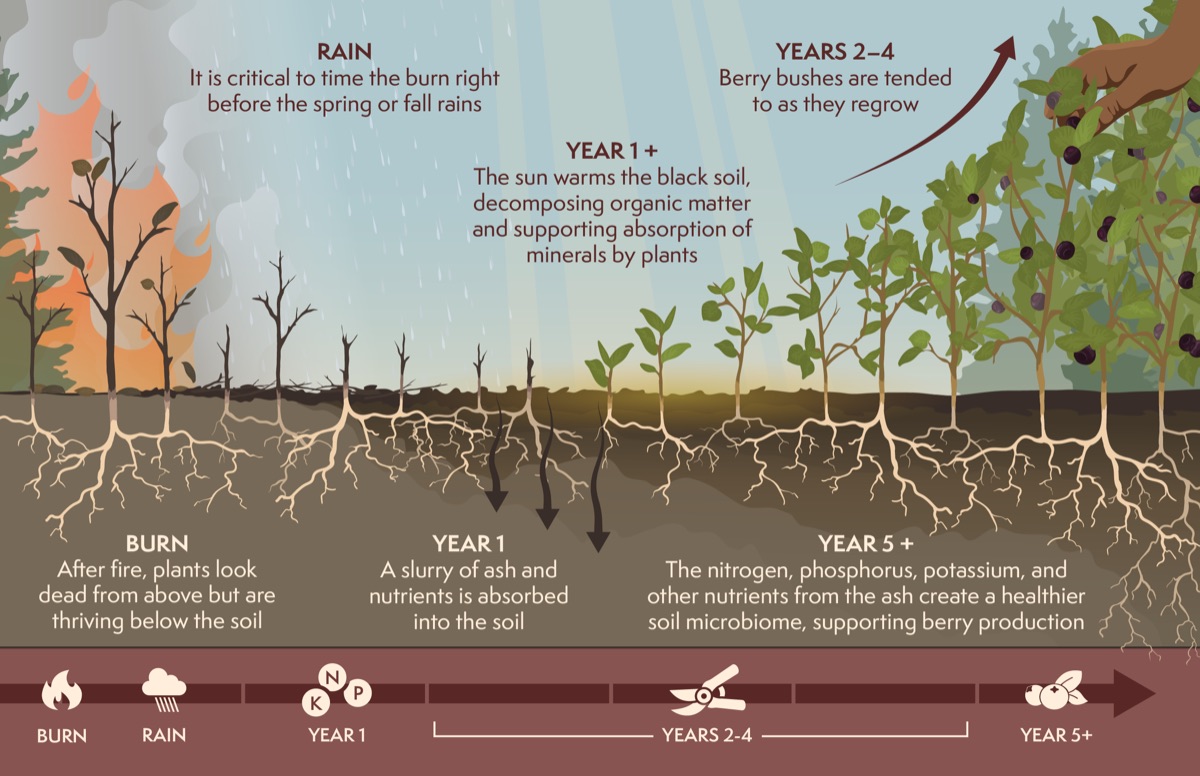
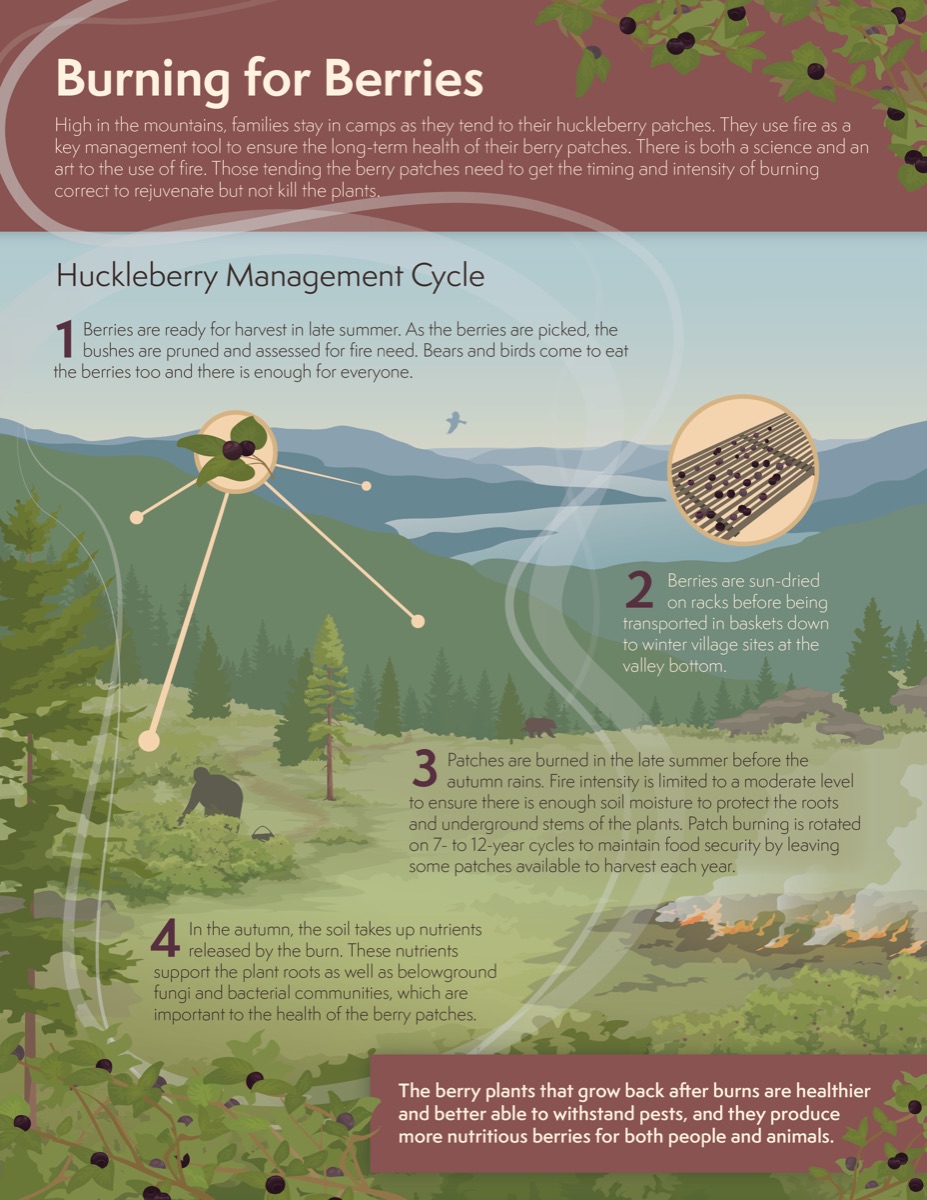
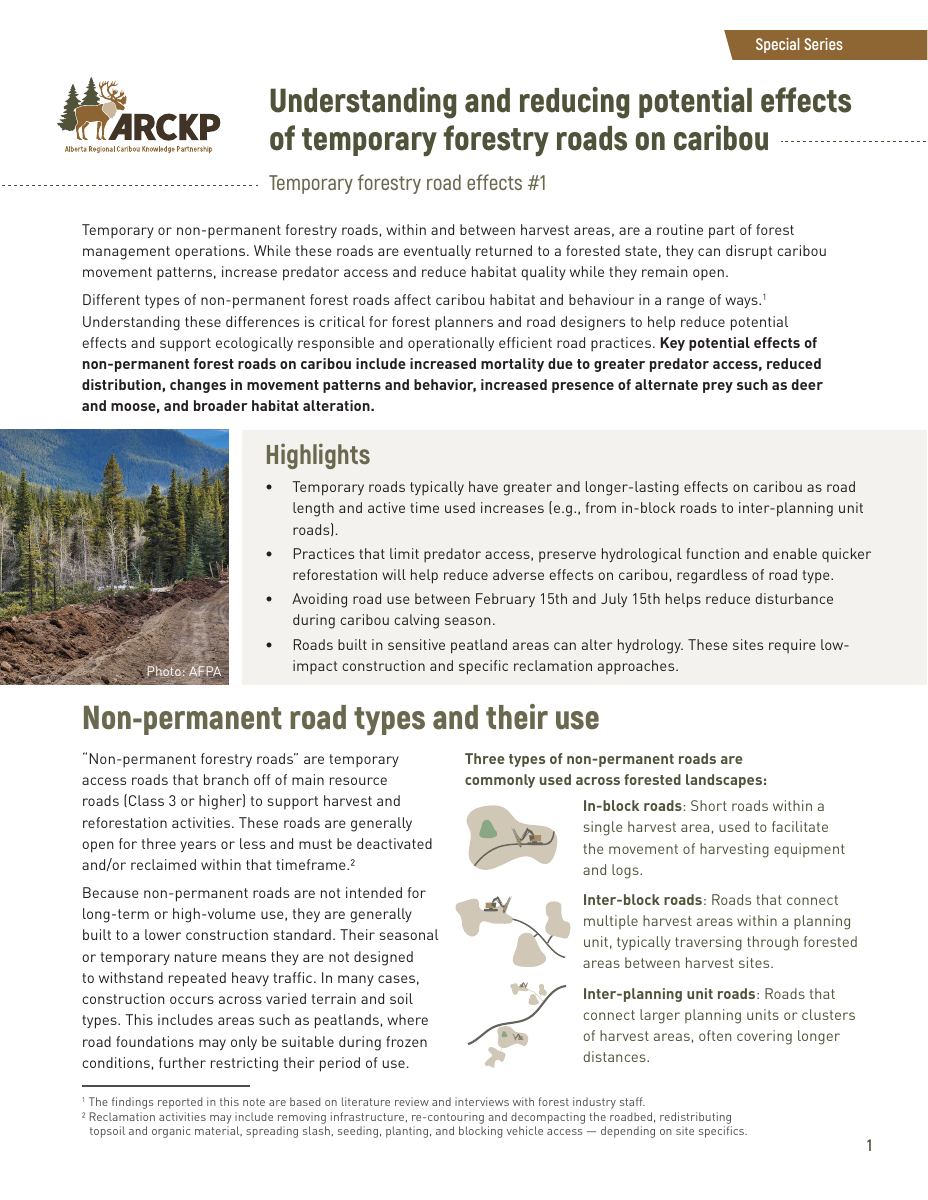
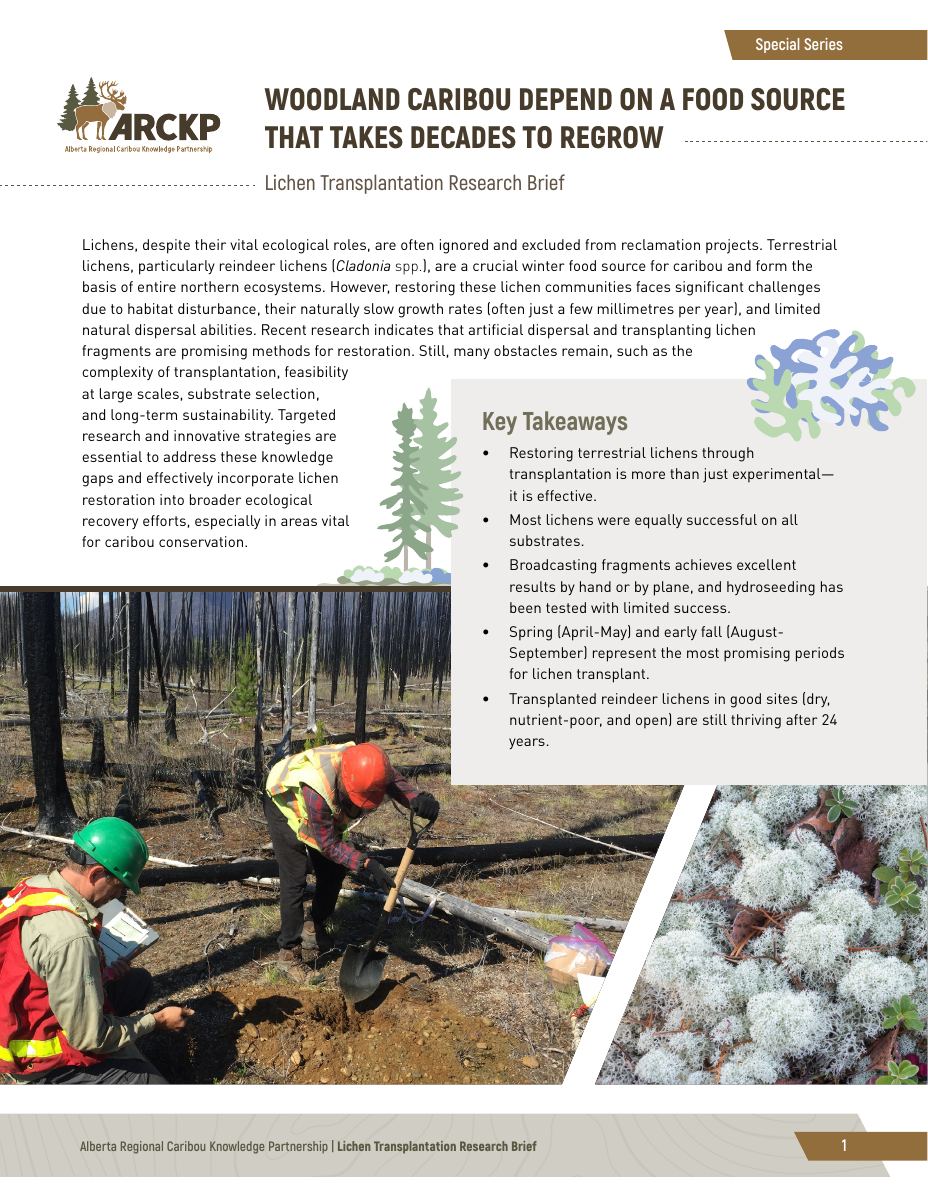
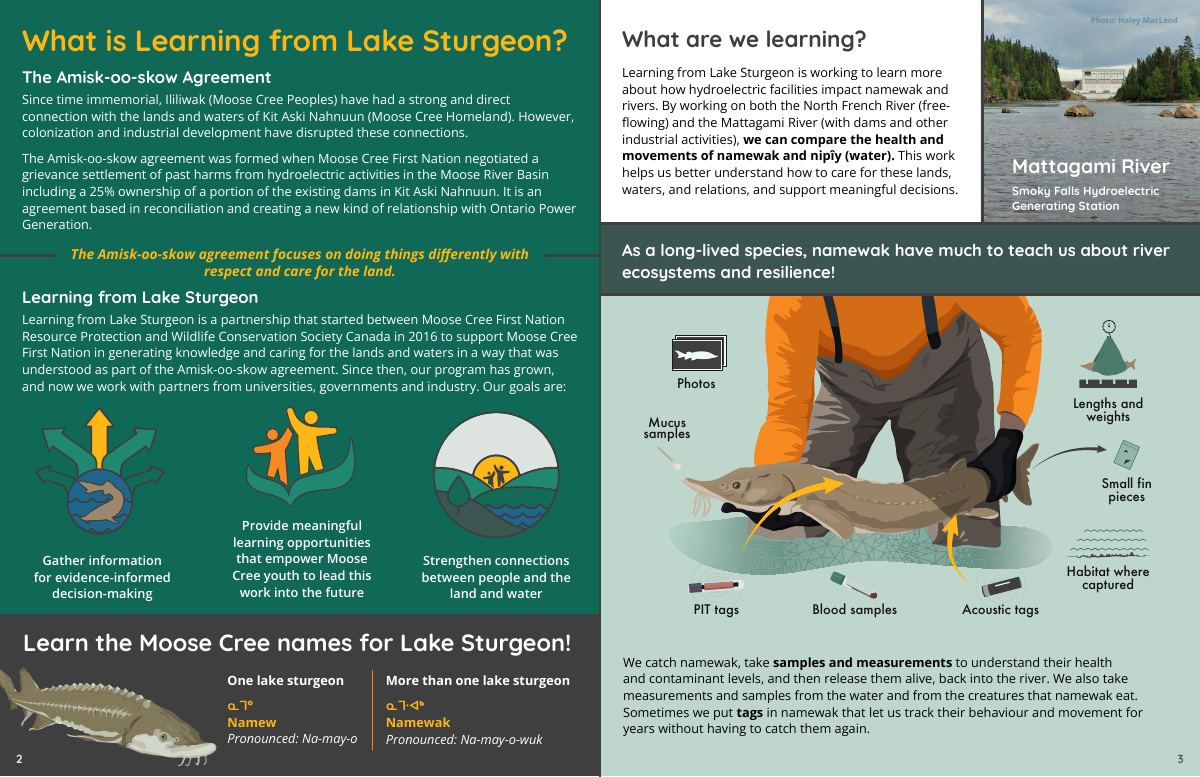
A short, visually structured document that stands on its own. A half-page summary of a single study is often called a graphical abstract.
Choose it whenLeadership, practitioners or the public need your findings or recommendations without reading the full report.
- Purpose
- Summarize complex topics, research or information in a concise, accessible format.
- Format
- Half a page to three pages, portrait, concise text and supporting visuals, ready to print or share as PDF or PNG.
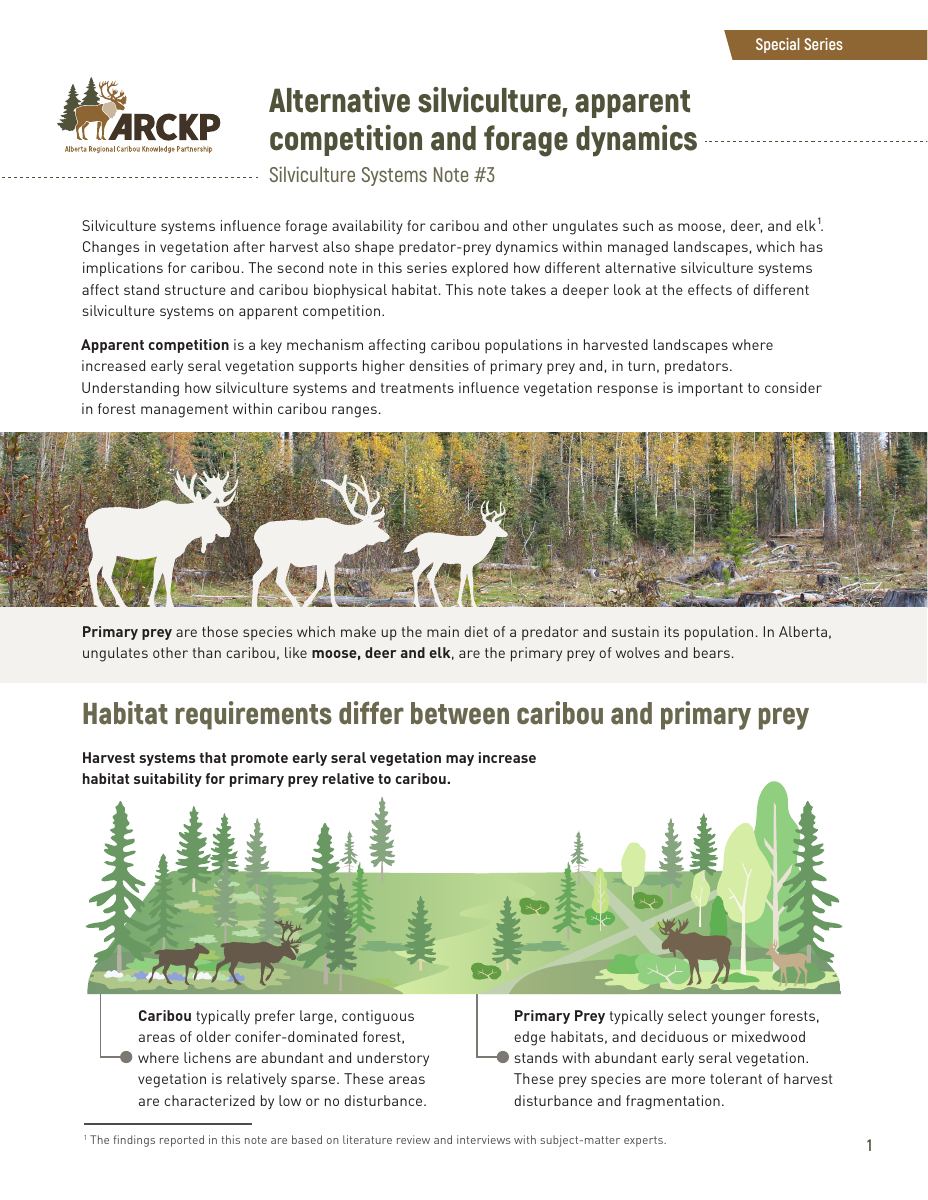
Briefing Note
The same purpose as an infographic, with more text than graphics. Clients sometimes still call them infographics.
Choose it whenYou have more to convey than an infographic can hold, and paragraph-style text is needed.
- Purpose
- Summarize complex topics for decision-makers, practitioners, organizations or the public.
- Format
- Two to four pages, portrait, concise text and supporting visuals, ready to print or share as PDF or PNG.
Zine
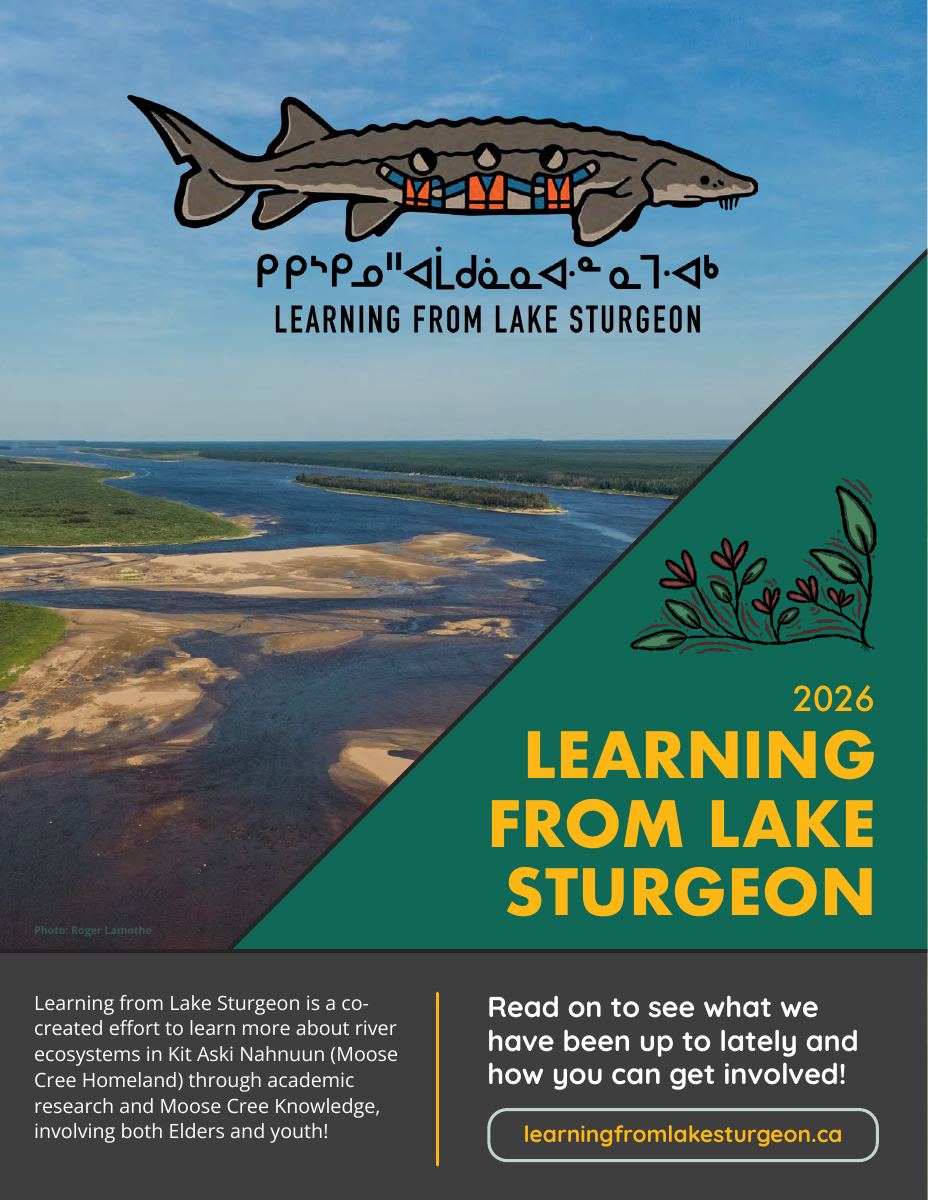
A small, informal illustrated booklet.
Choose it whenYou are reaching youth or community groups in an informal setting.
- Purpose
- Accessible, low-barrier science communication.
- Format
- A small print format, often A5 or smaller, printed as spreads like a standard booklet; illustrated, informal and creative in tone.
Read the full zine PDFPDF coming soon
Story Map
An interactive, map-based digital narrative that combines text, images and geographic data (ArcGIS).
Choose it whenThe goal is public engagement or organizational storytelling. A geographic dimension is a strong fit, though not a requirement.
- Purpose
- Engage a broad audience with a story that unfolds across space.
- Format
- An interactive web application (ArcGIS StoryMaps), scroll-navigable, with maps, images, text and embedded media.
Have science people need to see?
Tell us what you want your audience to understand, and who they are.